How real-time feedback shapes novice rowing: Insights from a recent study

by
Lars van Arkel
on

Turning data into better rowing: What force curves really tell us about technique
The first time a beginner sits on a rowing machine, everything looks simple. Pull the handle, push with the legs, repeat. But within the first few strokes, the data already tells a different story.
As part of a Sports Science minor within Creative Technology at the University of Twente, a small research project, conducted in collaboration with MoveLab Studio and RP3, set out to explore a simple but important question:
Can a real-time feedback system help novice rowers improve their technique?
To answer that, the study used the RP3 dynamic rowing machine. Unlike on-water rowing, the RP3 removes environmental noise such as wind and current, while still preserving the dynamic feel of a boat. What remains is movement in its purest form, and movement can be measured.
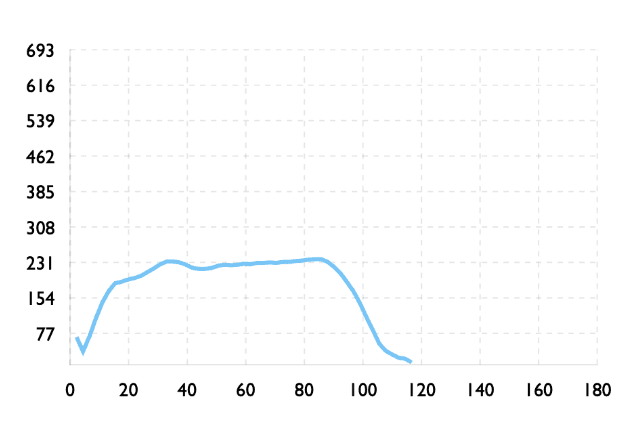
In addition, one of the most valuable features of the RP3 display is the force curve graph, which provides detailed, real-time feedback on exactly how force is applied throughout your stroke.
The biomechanics behind an efficient stroke
Rowing efficiency is not about strength, it’s about sequencing. The rowing stroke consists of four phases:
Catch
Drive
Finish
Recovery.
Across biomechanics research, one principle remains consistent: efficient strokes follow a smooth sequence: legs first, then trunk, then arms. When that sequence flows, power transfers cleanly into the handle. When it breaks down, the force curve reveals it instantly.
According to RP3, the overall shape of a force curve is influenced by three key factors:
Stroke length and peak force: These are largely determined by physiological characteristics, such as height, flexibility, and strength. Stroke length simply measures how far the handle travels during a stroke, while peak force represents the maximum force applied at any point in that stroke.
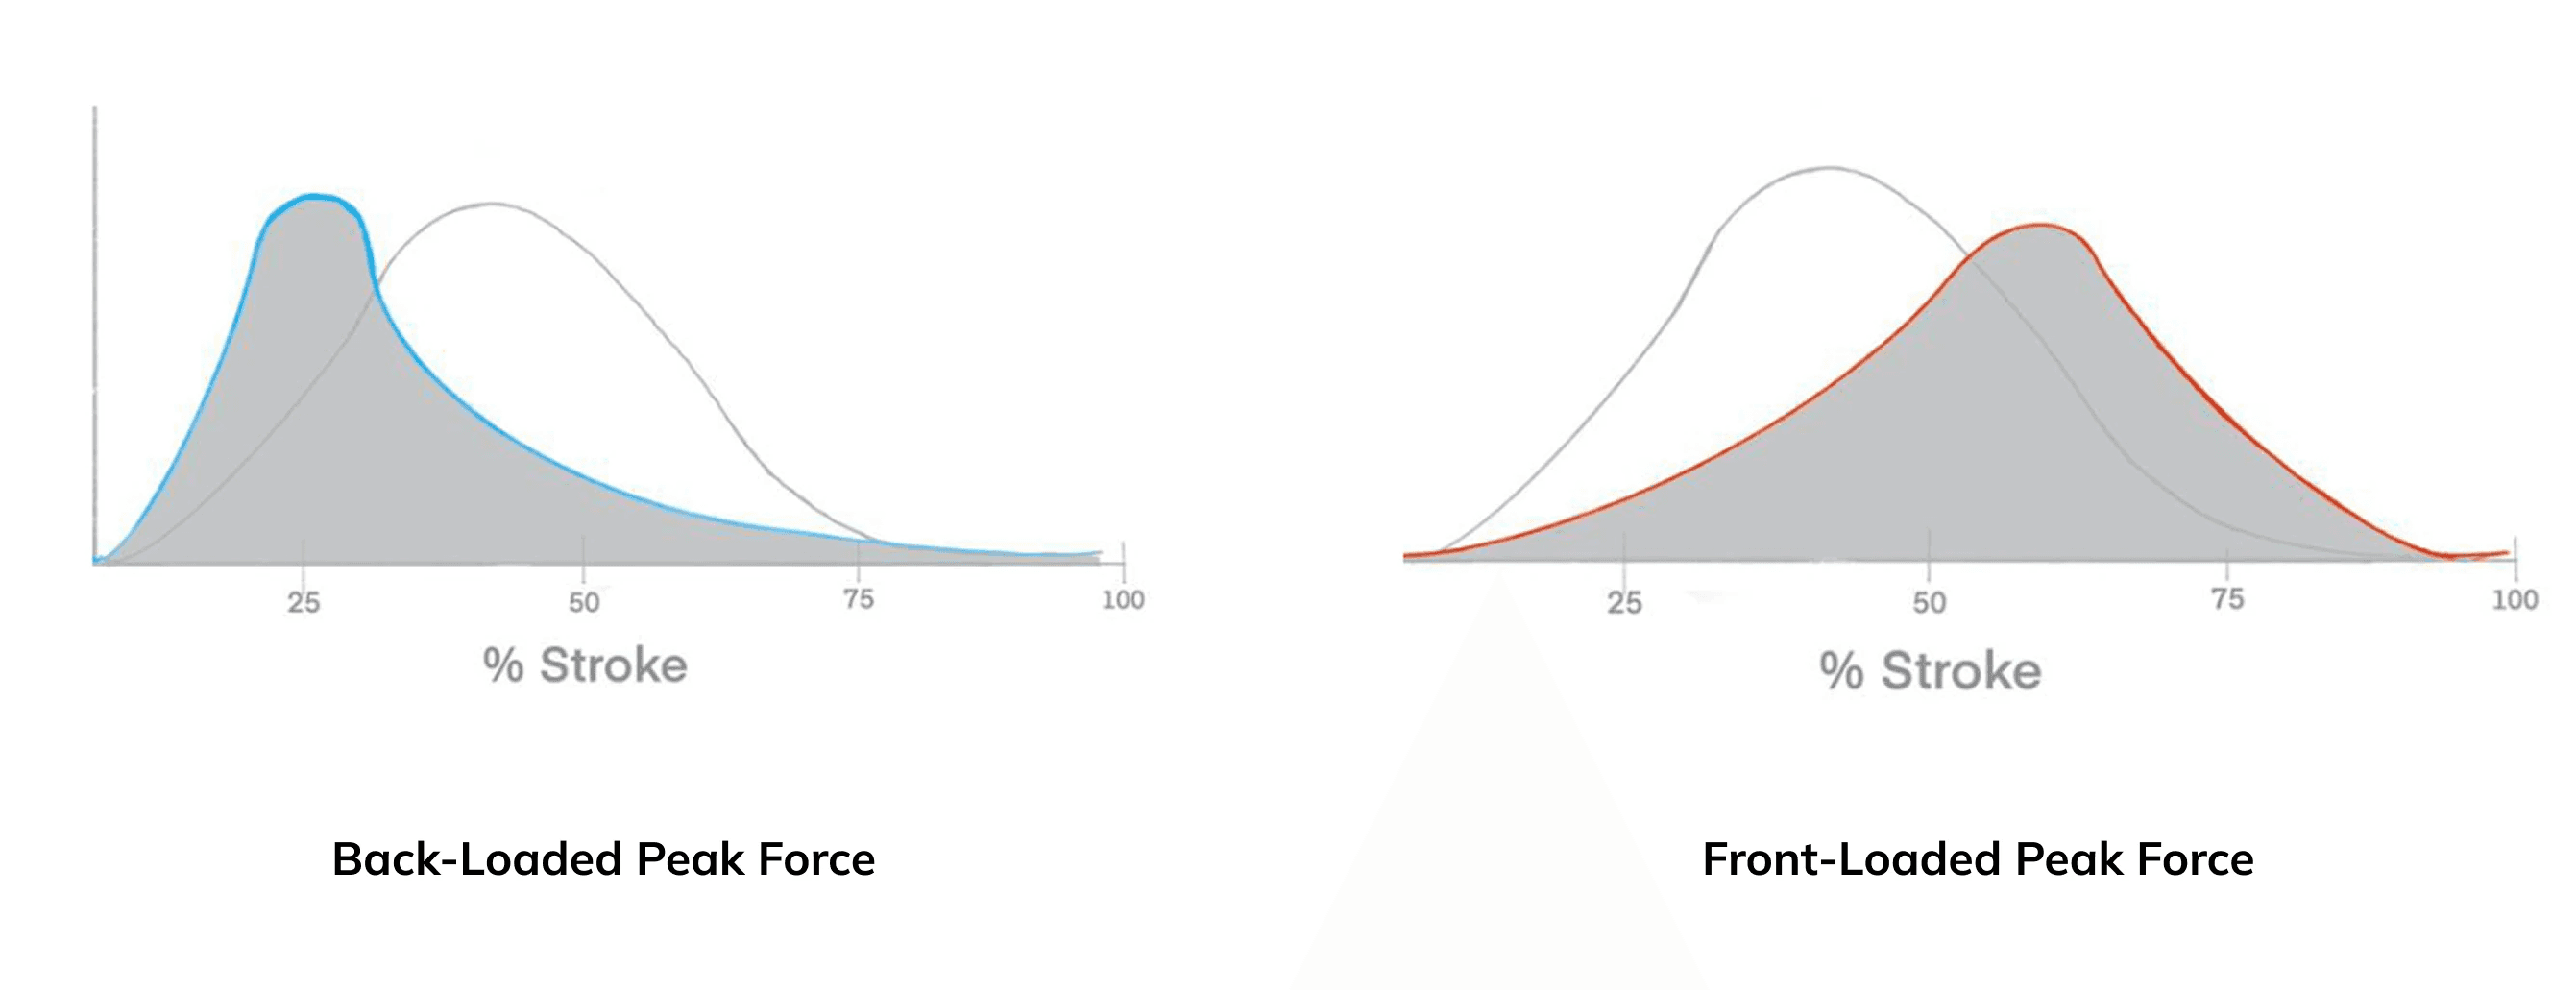
Timing of peak force: This indicates how power is distributed throughout the drive. A front-loaded stroke, like in Image 1, delivers force early, with a strong, fast push off the footplate. A back-loaded stroke, like in Image 2, starts more gradually, with pressure building later in the drive.
Area under the curve: This reflects the total energy transferred to the machine during the stroke, showing how force is applied before and after the peak. The curve may be relatively flat, indicating consistent force, or steep-sided, signaling rapid changes in force application.
Where beginners struggle and why the data confirms it
Before analyzing numbers, the researchers spoke with experienced rowers. Their observations were strikingly consistent.
Most pointed to the same moment in the stroke: the transition from the leg drive to the arm pull. It’s where timing matters most, and where beginners struggle most.
Common issues included poor posture, arms engaging too early, and inconsistent stroke length. When the force data was analyzed, those exact mistakes appeared again, this time as patterns in the curve.
Reading the force curve
A force curve is more than a line on a screen. It’s a signature of how the body moves.
The Peak
One of the most important signals is where peak force occurs during the drive. Research by Soper & Hume (2004) shows that applying force earlier in the drive correlates with more effective technique. According to RP3 guidelines, peak force should typically occur around 32–38% of the drive. This study worked within a ±4% window.
When peak force occurred too early (below 28%) the stroke was considered front-loaded. This often happened when the legs drove without proper connection to the trunk. When peak force occurred too late (beyond 42%) the stroke became back-loaded, usually indicating delayed leg engagement or excessive reliance on the arms and back. Correct peak placement resulted in smoother power delivery and noticeably higher efficiency.
Plateaus
Another recurring pattern was the appearance of plateaus in the force curve. Instead of rising smoothly to a peak and falling away, force stayed high and flat through the middle of the drive.
This “grinding” pattern is typical for beginners. The back opens too early, tension is held, and power is no longer transferred fluidly. Soper & Hume (2004) describe this as simultaneous joint extension, rather than the sequential coordination seen in skilled rowing. The result is wasted effort, reduced acceleration, and lower average power.
Multiple Peaks
Even more revealing were curves with multiple peaks. As rowing researcher Valery Kleshnev (2016) explains, propulsive force should be generated through a continuous sequence of legs, trunk, and arms. When that sequence breaks, the curve breaks with it. Each peak represents a body segment working out of sync, legs pushing, then pausing, followed by the back, then the arms. Momentum is lost, and efficiency drops.
Early Testing Results
To test whether feedback could influence technique, two novice participants completed four rounds of 40 strokes. The feedback system worked in such a manner that after each stroke, the software would determine the curve type and give back a visualization with real time feedback.
The participants began with no rowing knowledge, progressed through basic instruction, and then rowed with real-time feedback based on the force curve.
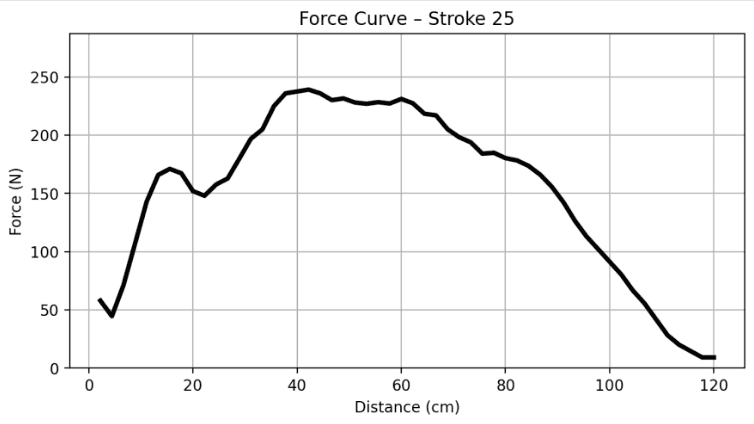
In the first session of 40 strokes, novice participants rowed without any prior instruction, and the force curves reflected significant inconsistencies. During the second session, after a brief explanation of basic rowing technique, small improvements began to appear. By the third session, when the students introduced their real-time feedback system, progress became much more noticeable. In the fourth session, where participants rowed independently after receiving feedback, some regression occurred but some of the improvements are still visible in the force curve. An example of the results for one participant is shown below.
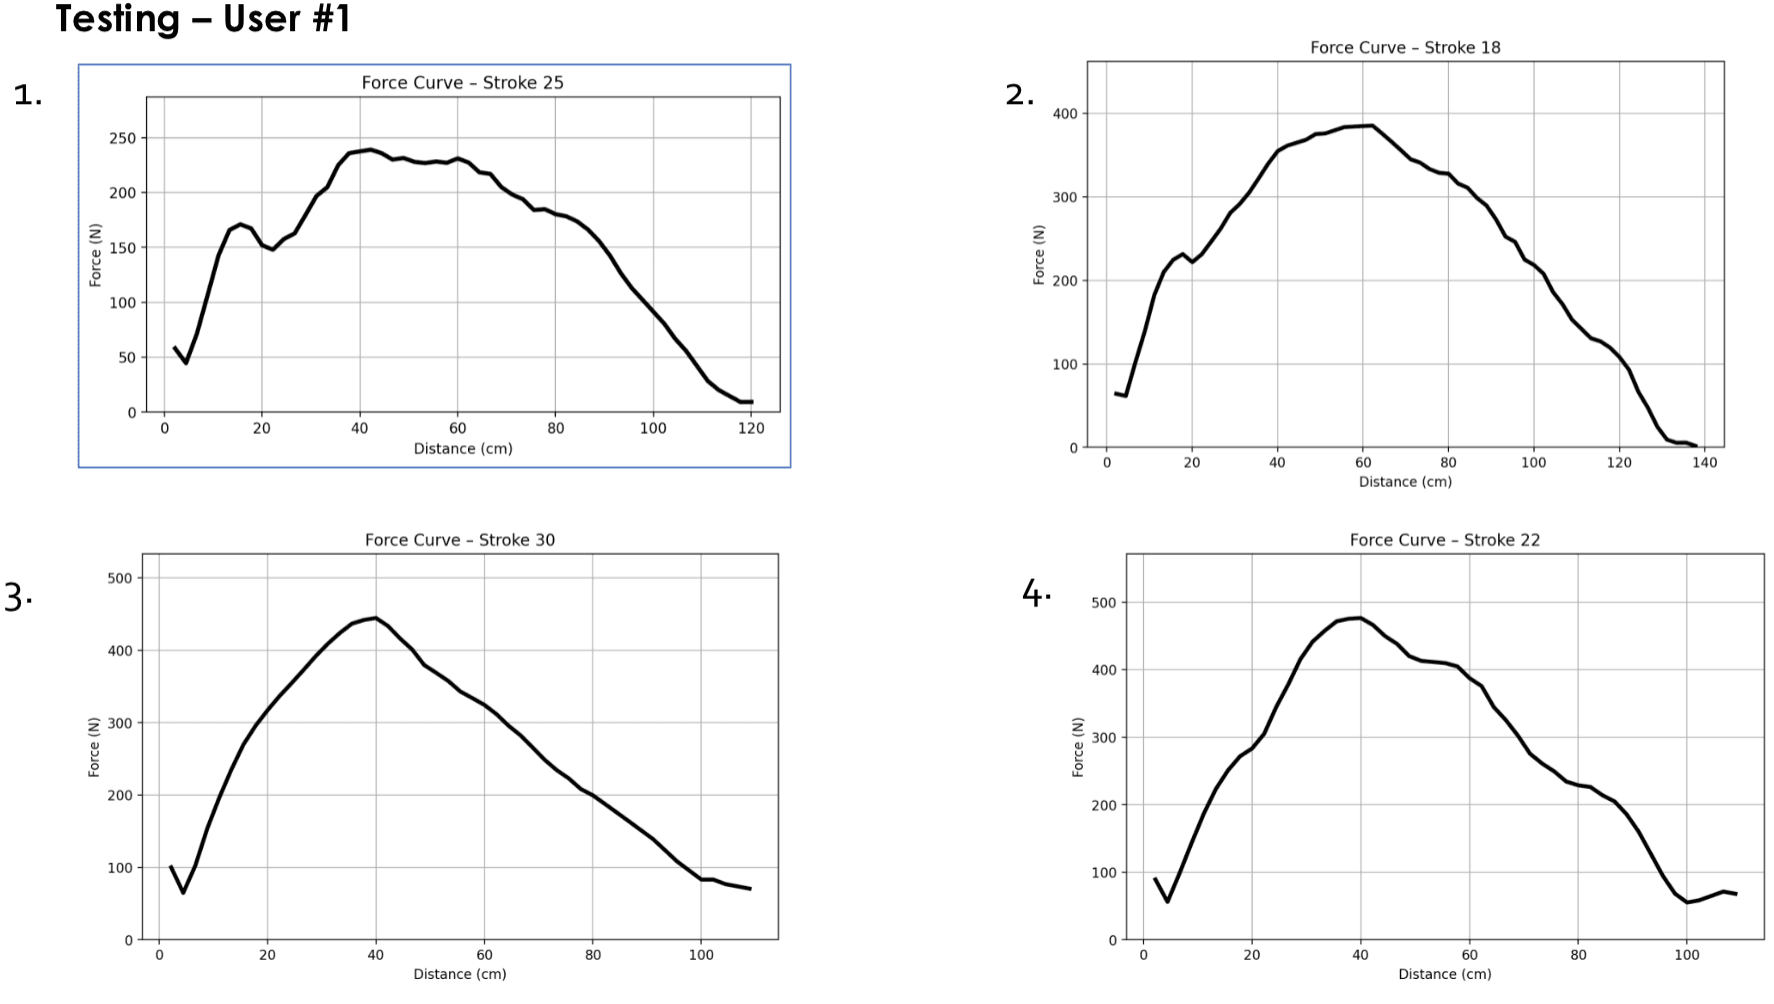
However, its important to note that the tests were done with a small sample size, only two parameters tested, and no control group. But even within these constraints, a pattern emerged. Strokes began to look more alike, timing improved and curves smoothed out showing that the feedback was working.
Why This Matters for Connected Fitness
What this research shows is not just that beginners make technical mistakes, but that those mistakes are measurable, repeatable, and correctable through data.
The force curve captured every breakdown in sequencing: early arm use, delayed leg engagement, uneven power application. More importantly, it showed that when feedback was introduced, those patterns began to change, even within a small and early-stage study.
For connected fitness, this is the real opportunity. Modern rowing machines already generate vast amounts of data. The difference between a screen that displays numbers and a system that improves technique lies in interpretation. Knowing where force peaks, how smoothly it is applied, and when timing breaks down allows feedback to be delivered at the exact moment it matters.
At MoveLab, this is how we think about performance technology. Not as dashboards, but as coaching layers, built on biomechanics, driven by clean data, and designed to guide better movement stroke by stroke. Because when data reflects how the body actually moves, it stops being abstract and becomes instruction that gives real value to the athletes.
A special thanks to the students from the minor of Sport Science and Technology and RP3.
All graphs and results are part of their study findings.


